Fun Math
We are really enjoying our Probability unit. Yesterday, we tried to predict a sample population, (coloured tiles in a paper bag) by drawing tiles from the bag. Students were asked to draw as many times as they deemed necessary (min. of 25) to be able to predict the colour of the 8 tiles in the bag. They recorded the frequency of the outcomes on a tally chart, then made their prediction in the form of a fraction.
 |
| A Similar Minds On Problem |
Once they had completed the experiment, they coloured in squares on chart paper to represent their results. We cut out the strips of coloured chart paper and taped like colours end to end to give us a visual representation of our collective data. Three student volunteers held the three coloured strips up so we could clearly see the data - and, wouldn't you know it, it looked like a bar graph!
The results showed a green bar twice as long as the yellow and blue bar, who were almost equal in length, leading us to believe that half of the tiles were green, a quarter were yellow and the other quarter were blue.
 |
| Conducting the Experiment |
Collecting the data
 |
| Representing the Results |
 |
| Predicting the Sample |
 |
| Assembling the Results |
 |
| Analyzing the Data |
 |
| Check Out Our Giant Bar Graph! |
We then carefully collected our bars and went down to the foyer, where we taped the bars from end to end to form a circle. We used masking tape from where the colours met to the center of the circle. The end product looked like a giant spinner or pie graph that clearly showed half green, and a quarter each of yellow and blue, further convincing us that 4/8 tiles were green, 2/8 were yellow, 2/8 were blue.
 |
| Creating a Circle Graph |
 |
| If you can see the tape clearly enough, you will note the giant spinner that show the results |
Finally, we returned to class to look into the bag to confirm our prediction! We learned that the greater the sample, the more accurate the prediction.
 |
| Revisiting the Results |
Today, we learned how to predict the probability of outcomes of more than one event or combination by using a tree diagram. Please ask your child to teach you, or show you how to use this strategy - they were awesome today! They were able to graph up to 72 different combinations using this method! (A problem more complicated then the one I would have given my Grade 7s!)
 |
| Enough Math for One Day! This Mathematician is ready to go home. |
Grade 8 Exhibits
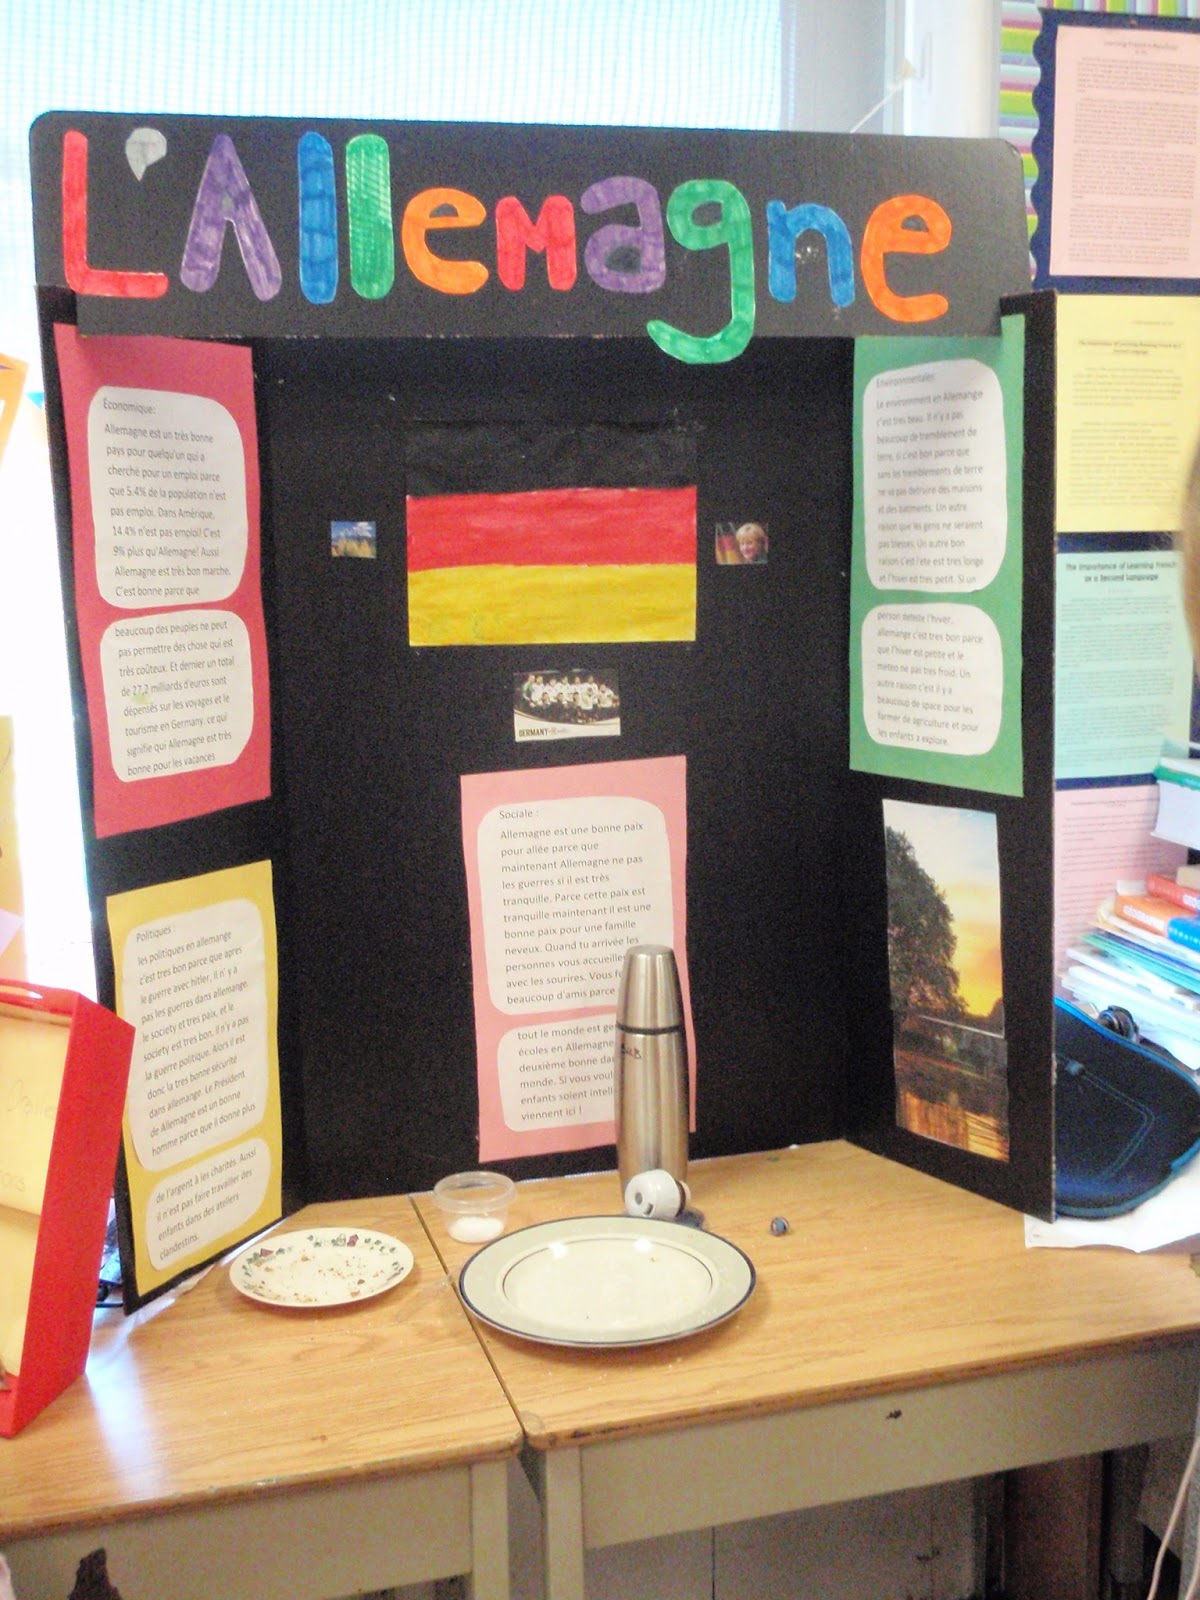
Yesterday afternoon, we had the opportunity to visit the Grade 8 exhibits (in preparation for our own Grand Opening of the Museum of Ancient Civilization,s on Monday). We were completely awed by the professionalism of the exhibits. Many students were inspired by the Grade 8 work and took home a few ideas for their own projects.
 |
| Add caption |
Merci les huitième années d'avoir partager vos montages avec nous. Excellent travail - félicitations!


No comments:
Post a Comment