Friday, October 25, 2013

Homework Help

Français: être et avoir

AVOIR

ÊTRE 

j'ai 

je suis 

tu as 

tu es 

il a 

elle a

il est

elle est 

nous avons 

nous sommes 

vous  avez 

vous êtes 

ils ont 

elles sont 


Math

Mean Median Mode

Mean - When people say "average" they usually are talking about the mean. You figure the mean by adding up all the numbers in the data and then dividing by the number of numbers. For example, if you have 12 numbers, you add them up and divide by 12. This would give you the mean of the data. 

Median - The median is the middle number of the data set. Sort of like it sounds. To figure out the median you put all the numbers in order (highest to lowest or lowest to highest) and then pick the middle number. If there is an odd number of data points, then you will have just one middle number. If there is an even number of data points, then you need to pick the two middle numbers, add them together, and divide by two. That number will be your median. 

Mode - The mode is the number that appears the most. There are a few tricks to remember about mode:  If there are two numbers that appear most often (and the same number of times) then the data has two modes. This is called bimodal. If there are more than 2 then the data would be multimodal. If all the numbers appear the same number of times, then the data set has no modes. 

Sunday, October 20, 2013

Our Week at a Glance


Data Management

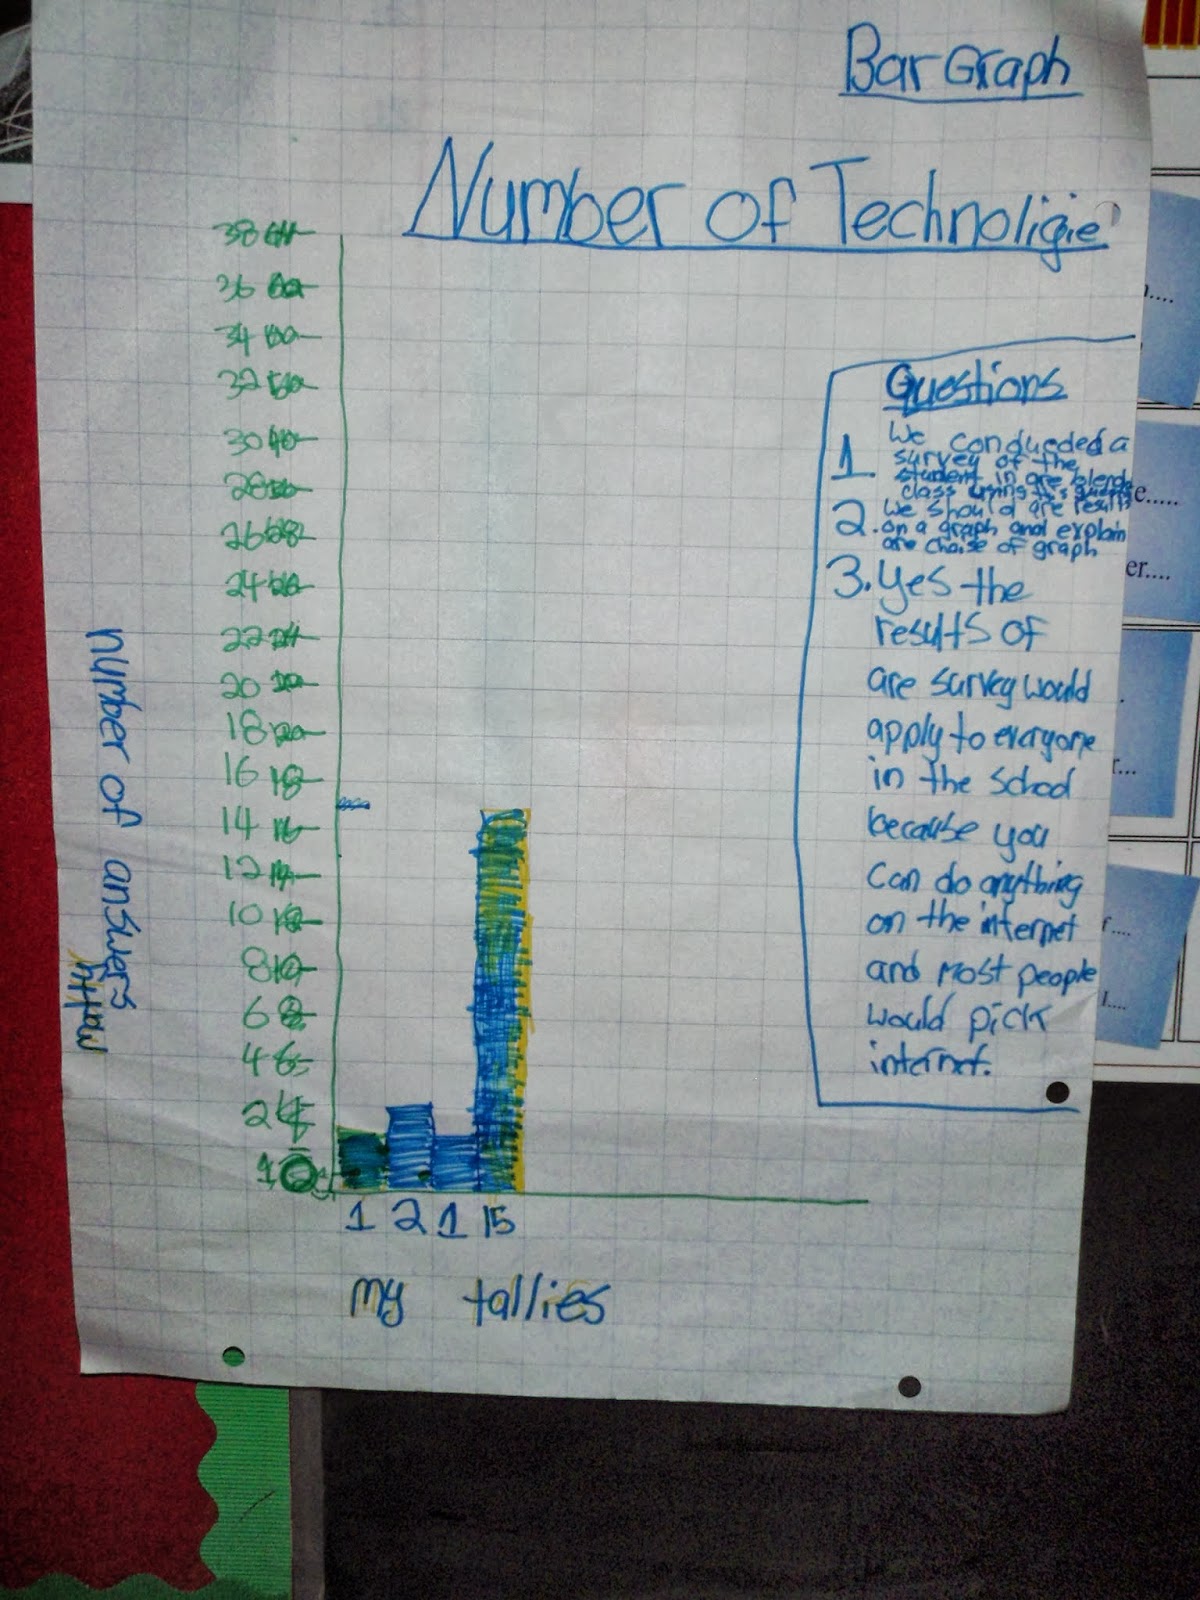
We began our unit in Data Management with the following task to activate students' prior knowledge. Surprisingly, all groups chose to display the results of their survey in a bar graph.  We discussed our work in a bansho.  From there, we co-created the success criteria for creating graphs.


On Monday, students created broken-line graphs on Excel.  We eventually got most of them loaded into our Google Doc Presentation, hoping we could access them from the ipads to describe trends and give feedback, but we still have some kinks to work out.   Here is what we've accomplished so far.  Some students should have referred to the success criteria before submitting their final graph, but this was their first graph using computers, so I think the primary focus was getting use to the program.

<iframe src="http://www.slideshare.net/slideshow/embed_code/27390608" width="476" height="400" frameborder="0" marginwidth="0" marginheight="0" scrolling="no"></iframe>

Then we tried our second online lesson using ipads and Google Docs.  Our intent was to put our knowledge of broken-line graphs to use on paper, upload our work and then give critical feedback, but the whole process took so long that we did not have time for the most valuable part - the group feedback and consolidation!  So although, the need for embedding technology into our daily lessons is very important, at this time the reality of it is quite frustrating.

<iframe src="http://www.slideshare.net/slideshow/embed_code/27390792" width="476" height="400" frameborder="0" marginwidth="0" marginheight="0" scrolling="no"></iframe>

 Français

In French, we continue to practise scripted conversations to build our vocabulary and fluency.  We read aloud and silently from little readers, focusing on pronunciation, language acquisition and comprehension strategies. We have a new word study list, adjectives, to support our writing and to prepare us for an upcoming writing project. 


Language Arts

In writing, we are concentrating on writing personal narratives.  We began with lessons and activities to help us generate topics for personal narratives, learn how to narrow them down to a "seed", and zoom in on the important details.  The past two days, students have been learning how to craft a lead, to hook and draw their reader in.  


During Writer's Workshop we have decided that we needed some guidelines to ensure our success.


We even have special writing folders to keep our Personal Writer's Notebook in, to house our mentor texts, and contain our current writing piece.


Sciences sociales

In Sciences sociales, we have begun to look at the different levels of government in Canada and their responsibilities, as well as the citizens responsibilities.  We have been working on piccollages on the ipads to help display the information we have gathered.  This is what we have so far.

frame src="http://www.slideshare.net/slideshow/embed_code/27391048" width="476" height="400" frameborder="0" marginwidth="0" marginheight="0" scrolling="no"></iframe>


GRRRRR!!!! IT DID NOT WORK!  I WILL FIGURE OUT HOW TO SHARE OUR GOOGLE DOC WORK IN THE BLOG LATER - IN THE MEAN TIME, YOU CAN SEE THEM ON THE PAGES ATTACHED TO THIS BLOG, SIMPLY BY CLICKING ON THE LINKS.

HOPE YOU ALL HAD A GOOD WEEKEND!

Friday, October 18, 2013

Mon Journal

Here are a few journal samples before editing.  Students are focussing on incorporating the verb "être" and adjectives into their writing.  They were asked to describe a variety of friends using a minimun of two adjectives.  In French, adjectives must agree with the noun they are describing, in gender and number.


Reading Responses - Thinking Beyond the Text: Making Connections


The following student samples are to give you an idea of a fully developed and fully supported text-to-text connection.  Ask to see your child's connection.  Together, please discuss what you really like about the connection (based on the success criteria) and what the next step should be. 


Tuesday, October 15, 2013

Technology Ups and Downs

Today, we were very excited to try out the ipads for social studies.  We used piccollage to create collages of a given topic.  However, the challenge was saving and uploading our collages to the class presentation on our Sciences sociales page.  We are still trying to work out the hiccups.

In math, we learned how to create a broken-line graph on Microsoft Excel.  One group had time to create their graph and describe the trends they saw.  The others are still a working on it.

 Unfortunately, even though it worked at home copying and pasting the Excel graph into our Google Doc Presentation on my blog did not work!  Students had to save and then email me their graphs, then I had to open them, copy them and paste them into our slide show.  So now, most groups still have to analyze the trends, and we need to consolidate our learning and give feedback to each group.  I did notice that many groups did not remember to use the success criteria for creating graphs - titles and labels are missing.  The docs are still in edit mode, so we will be able to revisit tomorrow.

Exciting as our learning was, not all went as smoothly as desired.  I hope student will show their parents what they learned today by visiting our Data Management page on this blog.

Tomorrow, we will continue both lessons -with the tech - and hope that everything works according to plan.


Monday, October 14, 2013

Interesting Facts About Reading

I found these facts posted on the First Lady of Tennessee's webpage, they were interesting enough to share.

 Did You Know? 


If a child reads for 20 minutes every day, they are exposed to about 1.8 million words of text every year. 1  That is 137 new words per minute! If families read together for 20 minutes a day, 7 days a week, they get more than 121 hours of bonding time every year! Many states use 3rd grade reading scores to predict the number of jail cells they might need in the future. 2

(About 3 out of 5 prisoners in America are illiterate.) 3

 For every year you read with your child, average lifetime earnings increase by $50,000. You make a $250,000 gift to your child from birth to age five by reading aloud, just 20 minutes a day!

Children who have not developed some basic literacy skills by the time they enter school are 3 - 4 times more likely to drop out in later years. 5

 1 Anderson, R.C., Wilson, P.T., Fielding, L.G. (1988). “Growth in Reading and How Children    Spend Their Time Outside of School,” Reading Research Quarterly, 23(3), pp. 285–303.
2 National Institute for Literacy, 1998. [(Arizona Republic (9-15-2004)].
3 U.S. Department of Education.
4 http://www.readingfoundation.org/parents.jsp
5 National Adult Literacy Survey, (1002) NCES, U.S. Department of Education

Friday, October 11, 2013

Math Assessment Exemplar


Here are some student samples of our most recent math assessment.  These may help parents and students discuss and review results together.

Students who require more practise with reading and writing numbers should visit this link: Naming Decimals or Naming Numbers. You may also want to visit the Nelson Math Companion Site or Edugains.


If you have any questions please post them on my CORKBOARD.

Happy Thanksgiving Weekend!  Enjoy your family time!